- The price is 589.5 USD currently with a change of -21.34 USD (-0.03%) from the previous close.
- The latest trade time is Monday, October 13, 17:28:52 +0500.
1. What Is QQQ?
“QQQ” is one of the most well-known exchange-traded funds (ETFs) in U.S. equity markets. Its formal name is the Invesco QQQ Trust, Series 1. The fund seeks to replicate the performance of the Nasdaq-100 Index, delivering exposure to 100 of the largest non-financial companies listed on the Nasdaq exchange.
Because the Nasdaq-100 is heavily weighted to large-cap technology, communication, and growth-oriented names, QQQ is often considered a barometer for the technology sector, innovation, and growth stocks. It combines the convenience of an ETF (liquidity, intraday tradability, low cost) with concentrated exposure to a particular slice of the U.S. equity market.
In short: QQQ gives investors access to the upside (and downside) of the Nasdaq-100 in a single tradable instrument.
2. Historical Background & Evolution
- QQQ was launched on March 10, 1999. (StockAnalysis)
- Originally, the fund was structured as a unit investment trust (UIT), a type of fund vehicle with constraints. (Wikipedia)
- Over time, QQQ’s popularity soared, becoming one of the most heavily traded ETFs in the U.S., often used both by institutional investors and retail traders. (etf.com)
- In 2004, the ticker temporarily changed to “QQQQ,” then reverted back to “QQQ” in 2011. (Wikipedia)
- Over its lifespan, QQQ has recorded periods of both dramatic gains (especially in tech bull markets) and severe drawdowns (e.g. during the dot-com bust). (Wikipedia)
Thus, QQQ has become a flagship vehicle representing U.S. large-cap tech / growth in the ETF space.
3. Structure, Index Methodology & Rebalancing
Index & Weighting
- QQQ tracks the Nasdaq-100 Index (NDX). (StockAnalysis)
- The Nasdaq-100 is a modified market capitalization–weighted index of non-financial companies listed on Nasdaq. (Wikipedia)
- Because of the “modified” weighting, the index imposes constraints to prevent any single stock from dominating. This helps maintain diversification (to a degree). (Investopedia)
- The index excludes financial companies (banks, insurance) entirely, which distinguishes it from many broad market indices. (Wikipedia)
Rebalancing & Reconstitution
- QQQ (i.e. the fund) is rebalanced quarterly, which ensures the ETF tracks changes in index weights. (Investopedia)
- The reconstitution (i.e. changes in inclusion/exclusion of companies) is performed annually, aligning with updates from Nasdaq for the Nasdaq-100. (Investopedia)
Because of this active maintenance, QQQ stays current with shifts among large-cap, non-financial, Nasdaq-listed names, but it still remains a passively managed vehicle relative to active stock picking.
4. Fund Details: Size, Expense, Liquidity
Assets Under Management, Liquidity, and Trading Volume
- As of the most recent data, QQQ has tens to hundreds of billions in AUM. For instance, ETFdb lists ~ $394.4B in AUM. (ETF Database)
- It is one of the most heavily traded ETFs in the U.S., offering excellent liquidity and tight bid-ask spreads. (etf.com)
- Because of its scale, many institutional and retail participants use QQQ as a “core tech / growth” allocation or as a hedge / overlay vehicle. (etf.com)
Expense Ratio, Structure & Costs
- The expense ratio is 0.20% annually. (Invesco)
- Under the current UIT structure, QQQ has certain limitations: it cannot engage in securities lending (or limited) and cannot distribute profits in the same way an open-end fund might. (Investopedia)
- Recently, a proposed structural change is under consideration: converting QQQ from a UIT to an open-end ETF structure. This would allow greater flexibility, potentially lower expense, and revenue opportunities via securities lending. (Investopedia)
- The shareholder vote on this change is scheduled for October 24, 2025. (Investopedia)
If approved, that structural change could modestly reduce costs for investors and improve operational flexibility.
5. Holdings & Sector Exposure
A critical part of analyzing QQQ is understanding which stocks dominate the fund, and which sectors are concentrated.
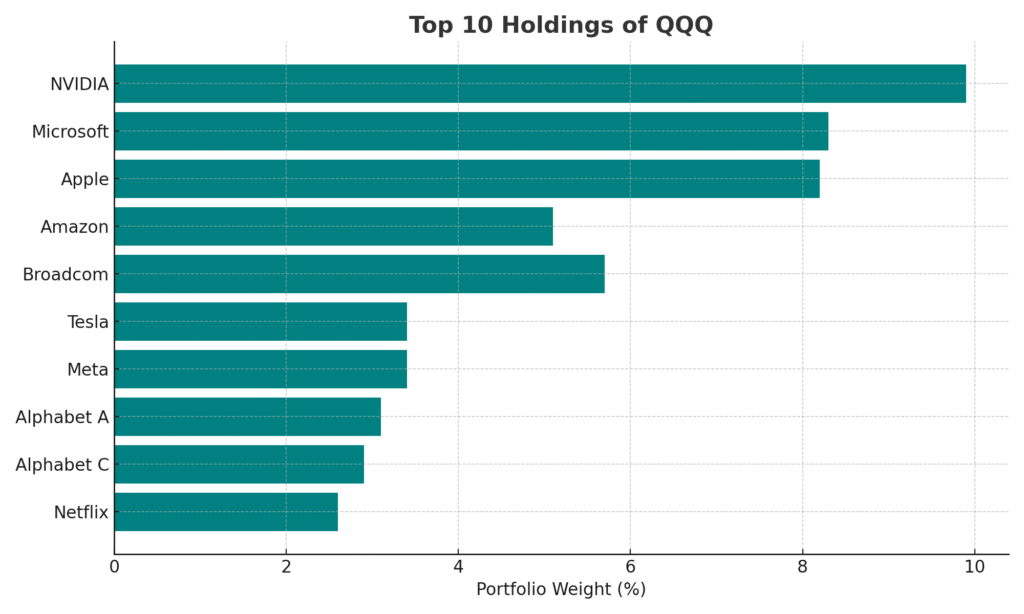
Top Holdings & Concentration
- The top 10 holdings often constitute ~45–55% of the fund. (Investopedia)
- According to recent holdings data:
- NVIDIA (NVDA) is often the largest single exposure (~ 9% or more). (StockAnalysis)
- Microsoft (MSFT) occupies ~ 8-9%. (Morningstar)
- Apple (AAPL) is also a major weight, around 8%. (Morningstar)
- Broadcom (AVGO), Amazon (AMZN), Meta (META), Tesla (TSLA), Alphabet (GOOGL / GOOG), Netflix (NFLX), and Costco (COST) are among other top names. (Schwab)
- From Schwab holdings:
NVDA 9.90%, MSFT 8.27%, AAPL 8.23%, AVGO 5.68%, AMZN 5.12%, TSLA 3.43%, META 3.40%, GOOGL 3.08%, GOOG 2.89%, NFLX 2.62%. (Schwab)
- By TipRanks / other data, QQQ has ~102 holdings, and the top 10 can make up ~ 50–53%. (TipRanks)
- The holdings list is dynamic and shifts with rebalancing and index changes. (Invesco)
Thus, QQQ is top-heavy, and its performance often hinges on how a handful of mega-cap technology stocks fare.
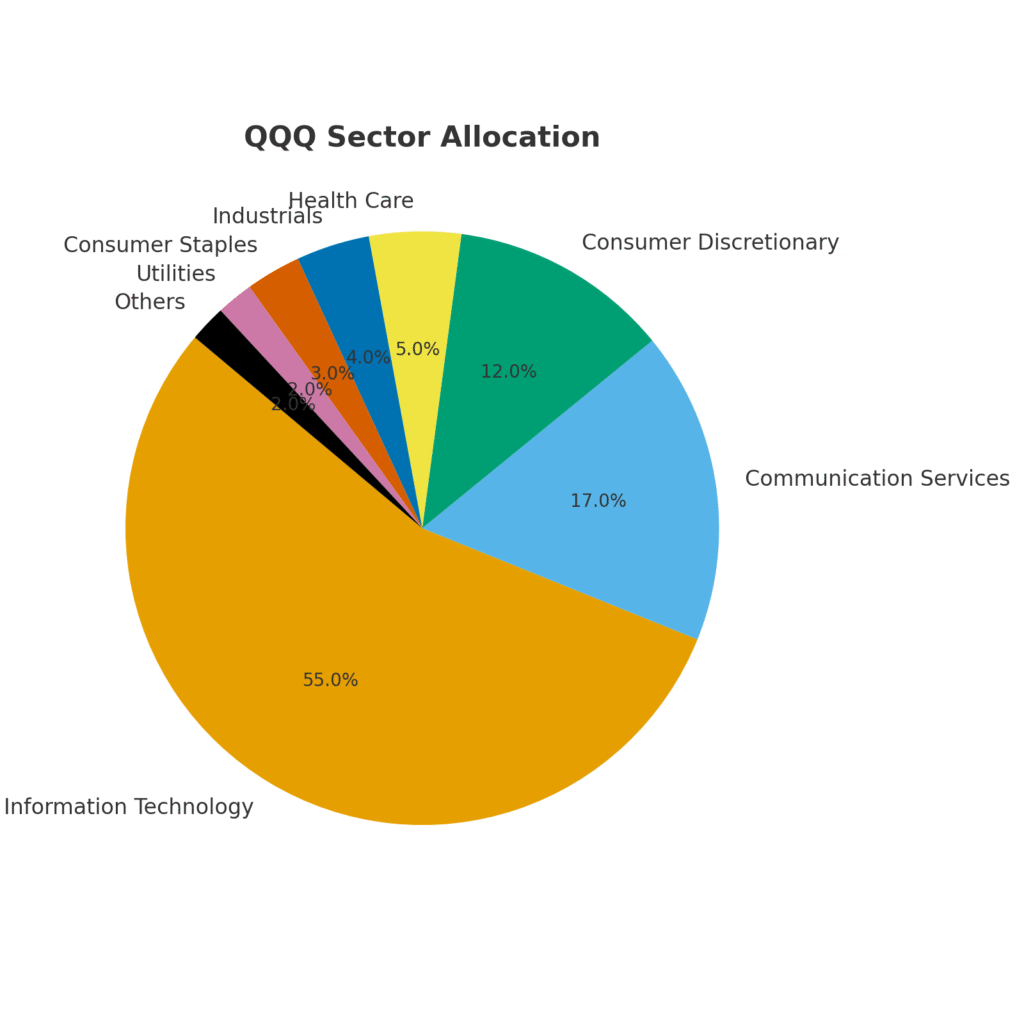
Sector & Thematic Exposure
By sector, the breakdown typically is:
- Information Technology: ~ 50–55%+ (Seeking Alpha)
- Communication Services: ~ 15–17% (Seeking Alpha)
- Consumer Discretionary / Consumer Cyclical: ~ 10–15% (Seeking Alpha)
- Healthcare, Industrials, Consumer Staples, Utilities, Basic Materials, Energy: the remainder, each typically < 5% in many cases. (TipRanks)
- Very minimal exposure to financials, owing to the index’s exclusion. (Invesco)
This concentration in growth, tech, and innovation is both a strength (when innovation is rewarded) and a source of cyclicality and risk (in downturns).
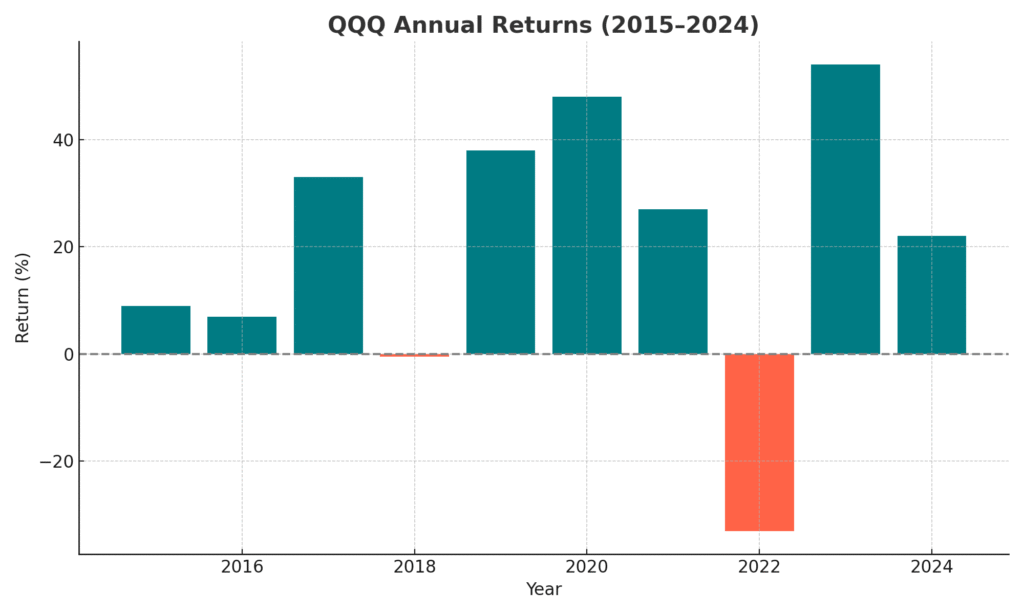
6. Performance & Return Metrics
Historical Returns & Outperformance
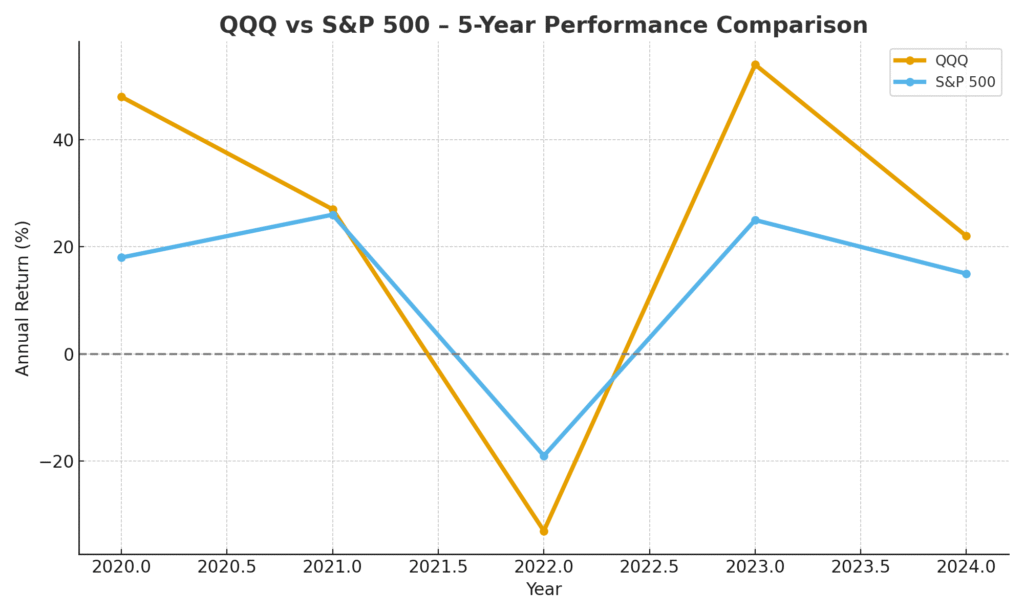
- Over a 5-year window, QQQ delivered a cumulative return of ~129.54% (i.e. $10,000 → ~$22,954). (Invesco)
- QQQ has outperformed the S&P 500 in 7 of the last 10 years, as per Invesco. (Invesco)
- Over long spans, QQQ’s returns have been impressive, especially during sustained bull markets in technology. (ETF Database)
- It has delivered far higher returns than broad benchmarks during favorable macro and tech cycles. (etf.com)
However, past performance is not predictive, and periods of underperformance do occur.
Return Metrics & Ratios to Watch
When analyzing QQQ, investors should examine:
- Annualized return / CAGR (compounded annual growth rate)
- Volatility / standard deviation
- Sharpe ratio (risk-adjusted return)
- Maximum drawdown (the worst peak-to-trough decline)
- Beta relative to broad benchmarks like the S&P 500
- Correlation with market indices
According to Market Chameleon data:
- QQQ’s beta is ~1.18, indicating higher sensitivity to market moves. (Market Chameleon)
- Its correlation with SPY (S&P 500 ETF) is ~0.94. (Market Chameleon)
Because of its concentrated, high-growth profile, QQQ tends to outperform in bull markets and lag in bear markets relative to diversified equities.
Risk-Adjusted Returns & Volatility
QQQ’s concentration in tech and high-growth stocks means it can generate strong returns when innovation is rewarded, but those returns come with elevated volatility. During market downturns or rate-hike cycles, QQQ tends to fall harder. (etf.com)
Because of this, investors often use QQQ alongside other, more defensive or diversified holdings to smooth the ride.
7. Risk Profile & Volatility
Investing in QQQ is not without risks. Below is an in-depth risk analysis.
Concentration Risk
- With the top ~10 holdings making up a large share of the fund, QQQ is susceptible to idiosyncratic risk: if NVIDIA, Microsoft, or Apple suffer, they can drag down performance disproportionately.
- Heavy exposure to one sector (technology / growth) creates sector risk.
Volatility & Drawdowns
- QQQ tends to magnify market swings. In bullish regimes, it soars; in corrections, it falls steeply. (Investopedia)
- During market stress, tech / growth stocks are often hit hardest, which can lead to sharp drawdowns.
- For example, in severe pullbacks, QQQ can suffer 20–30%+ declines, depending on broad tech sentiment.
Valuation Risk & Overcrowding
- Many of QQQ’s holdings are high-growth with elevated valuations, leaving limited margin for error if fundamentals disappoint.
- In periods when investors rotate out of growth into value, QQQ may underperform.
Interest Rate & Macro Sensitivity
- QQQ is sensitive to interest rate changes. Rising rates can hurt growth projections, discount future earnings, and reduce the attractiveness of high-growth / tech names.
- Macro risks — inflation, regulatory changes, geopolitical shocks — can disproportionately affect tech and growth companies.
Liquidity & Market Risk
- While QQQ is very liquid, extreme market dislocations (e.g. flash crashes) can create disorderly trading conditions even in major ETFs.
- Tracking error risk: in volatile environments, the ETF may deviate slightly from the index.
Structural / Regulatory Risk
- Because QQQ is currently a UIT, its structure constrains certain actions (e.g. securities lending) and limits flexibility. (Wikipedia)
- The proposed structural change may reduce some risks but also introduce new ones (e.g. operational, governance). (Investopedia)
Understanding these risks is crucial before allocating capital to QQQ.
8. Dividend, Tax, and Cash Flow Considerations
Though QQQ is growth / tech-oriented, it does distribute income and has tax considerations.
Dividend Yield & Distribution
- QQQ’s dividend yield is modest (as of recent data, ~ 0.47%). (Investing.com)
- The yield is low because many holdings either reinvest their profits, don’t pay dividends, or have lower payout ratios (common in growth stocks).
- Distributions are made periodically (quarterly, typically, depending on holdings’ dividends).
Tax Efficiency & Capital Gains
- As with most ETFs, QQQ is relatively tax efficient due to in-kind creation/redemption mechanisms.
- However, shareholders should still be aware of capital gains from distributions, especially if the fund rebalances or sells holdings that generate gains.
- For non-U.S. investors (e.g. in Pakistan or elsewhere), withholding taxes, foreign dividend taxation, and currency effects matter.
Cash Flows & Reinvestment
- Because yield is low, much of return comes via capital appreciation rather than income.
- Investors looking for income may need to complement QQQ with dividend-focused instruments.
9. QQQ vs Other Tech / Broad Market ETFs
To properly position QQQ in a portfolio, it’s prudent to benchmark it against alternatives.
SPY / VOO / Broad Market ETFs
- SPY and VOO (tracking the S&P 500) are broader and more diversified across sectors; thus, they typically have lower volatility and less extreme swings compared to QQQ.
- During tech-led bull runs, QQQ tends to outperform SPY / VOO; conversely, in rotation away from growth, QQQ may lag.
- QQQ’s beta (1.18) suggests higher volatility relative to broad benchmarks. (Market Chameleon)
- QQQ has delivered strong alpha over many years vs broad indexes, but with added risk.
QQQ vs Sector / Thematic ETFs
- There are many pure tech ETFs (e.g. XLK, FTEC, or more concentrated ones) — these might offer narrower, more aggressive exposure to specific subthemes (AI, semiconductors, cloud).
- QQQ offers a diversified “tech + growth” basket, which may reduce idiosyncratic risk relative to ultra-narrow sector funds.
- Some thematic ETFs (e.g. AI, robotics, cybersecurity) might outperform during certain waves, but also suffer bigger drawdowns when momentum reverses.
QQQ vs QQQM (the “mini” version)
- Invesco offers QQQM, a version of QQQ with similar exposure but at a lower share price, targeted more to retail investors (though with lower liquidity). (Wikipedia)
- QQQ remains the more liquid, institutional-grade vehicle; QQQM trades less heavily, but is functionally similar in exposure.
Trade-Offs & Suitability
- QQQ is ideal when you want growth / innovation tilt in a core equity allocation.
- For more balanced or risk-managed portfolios, combining QQQ with defensive, dividend, or value strategies is common.
- Some investors use QQQ as a satellite allocation (rather than core) because of its higher risk.
10. Strategies for Investing in QQQ
Here are some strategies and considerations for using QQQ effectively in portfolios.
Buy-and-Hold / Core Growth Exposure
- For long-term growth investors bullish on technology, one can allocate a fraction (e.g. 10–25%) of equity allocation to QQQ.
- Over time, compounding and secular tech trends (cloud, AI, semiconductors) may favor QQQ.
Dollar-Cost Averaging (DCA)
- To manage volatility, many investors use periodic investments (monthly, quarterly) into QQQ to smooth entry points.
- This helps mitigate timing risk and dampens the impact of market swings.
Tactical / Momentum Overlay
- Some traders apply momentum or trend-following overlays on QQQ, entering on breakouts or exiting near technical thresholds.
- Because QQQ is highly liquid and widely tracked, it is suitable for tactical overlays.
Pairs or Hedged Strategies
- A portfolio may hold QQQ plus short positions or put options to hedge downside.
- One can also pair QQQ with inverse ETFs or use options to express views (e.g. covered calls, protective puts).
Rotation / Rebalancing Strategies
- Combine QQQ with value, dividend, or low-volatility ETFs; periodically rebalance between them.
- On signals of growth rotation out, reduce QQQ exposure; when technology strength returns, reallocate back.
Risk Management Rules
- Use stop-losses or trailing stops to protect from steep declines.
- Limit the maximum allocation to QQQ (e.g. no more than 30–40% of equity exposure), given its volatility.
Investors should always define an exit plan / risk tolerance when using QQQ aggressively.
11. Recent Developments & Proposed Structural Change
A key recent development is the planned transformation of QQQ’s fund structure.
Proposed Conversion from UIT to Open-End Fund
- Invesco has filed to change QQQ from its unit investment trust (UIT) structure to a more conventional open-end ETF structure. (Investopedia)
- If approved (vote scheduled for October 24, 2025), the change would allow QQQ to:
- Engage in securities lending (earning additional revenue). (Investopedia)
- Improve operational flexibility (e.g. better cash handling)
- Potentially lower the expense ratio (proposal suggests from 0.20% to ~ 0.18%) (Investopedia)
- Grant Invesco more leeway in managing flows vs constraints of a UIT. (Investopedia)
- The change is seen as positive by many, since it modernizes QQQ and aligns it with the structure of many newer ETFs. (Investopedia)
- However, the change also involves governance shifts (new board of trustees, etc.) and potential short-term transition costs. (Investopedia)
If the conversion passes, it may make QQQ more efficient and investor-friendly going forward.
Market Reactions & Implications
- Invesco’s stock jumped over 15% on the announcement, reflecting investor enthusiasm for the structural change. (Investopedia)
- Many view the update as overdue, since the majority of modern ETFs operate in an open-end structure. (Barron’s)
- If the expense ratio is cut, even marginally, it boosts the net returns to investors over long time horizons.
Investors should monitor the vote outcome and subsequent implementation closely.
12. Outlook, Catalysts & Risks
Potential Catalysts & Growth Drivers
- Technology / Innovation Surge: Advances in AI, cloud, quantum computing, semiconductor scaling, autonomous systems could drive upside in many QQQ holdings.
- Secular Trends: Long-term adoption of digital transformation, 5G/6G, IoT, robotics, biotech — sectors well represented in QQQ — can fuel growth.
- Structural Change & Cost Reduction: If the structural conversion succeeds and lowers expense, it enhances net returns.
- Capital Flows & Investor Sentiment: As growth / tech rally, capital may continue flowing into QQQ from institutional and retail investors.
- Global Exposure & Innovation Leadership: U.S. leads in many innovation frontiers; QQQ’s exposure taps these global secular dynamics.
Risks & Headwinds
- Rate Hikes / Monetary Tightening: Higher interest rates discount future earnings and may depress growth stock valuations.
- Regulatory / Antitrust Pressure: Big tech names may face regulatory scrutiny or anti-competition investigations, which could impact valuations.
- Valuation Backlash / Rotation to Value: If markets rotate from growth to value, QQQ may underperform.
- Overconcentration in Few Names: A negative surprise in any top holding (say, NVDA or MSFT) can disproportionately drag performance.
- Structural / Operational Risk During Transition: Converting the fund’s structure introduces execution risk and trust among investors.
- Macro / Geopolitical Shocks: Recession, trade war, supply chain ruptures, AI-related disruptions.
Given these, the outlook is positive if innovation continues to be rewarded, but tempered by cyclical risks and macro sensitivities.
13. Conclusion
The Invesco QQQ (QQQ) is a premier ETF for accessing large-cap U.S. technology and innovation companies via a single, highly liquid vehicle. With over two decades of history, it has remained a favorite among growth investors, traders, and institutions seeking exposure to high-growth secular trends.
However, QQQ is not for the faint of heart. Its concentrated portfolio, high volatility, sensitivity to macro shifts, and valuation risk demand careful risk management, prudent allocation, and a clear investment horizon. The fund’s potential structural transformation adds a new dimension to its future.
For investors seeking to tilt toward innovation while maintaining access to U.S. equities, QQQ is a powerful tool—if used wisely, with awareness of both upside opportunity and downside risk.